

Summary
- Many investors seeking higher returns have turned to investment vehicles focused on private equity, real estate, and private credit, which generally offer an illiquidity premium.
- Yet these investments also present a liquidity-management challenge: Investors must maintain a ready pool of funds to meet capital calls, which can occur at any time.
- Based on our analysis of historical capital calls, we believe a tiered approach to liquidity – in which holdings correspond to risk and timing considerations – can offer an appealing and flexible way for investors to optimize the total return in an alternatives allocation.
Many investors seeking higher returns have turned to private assets. Vehicles focusing on private equity, real estate, and private credit generally offer an illiquidity premium. But they also present a liquidity-management challenge: Investors must maintain a ready pool of funds to meet capital calls, which can occur at any time.
When measuring return on committed capital, holding cash may be suboptimal and erode the Illiquidity premium investors seek. So how can one optimize the risk and return of uncalled capital?
We propose a framework based on historical call behavior of private equity and private debt funds. We detailed our analysis last month in the In Depth piece, “Cash for Calls: A Quantitative Approach to Managing Liquidity for Capital Calls .” A tiered approach to liquidity, in which holdings correspond to risk and timing considerations, lies at its core.
Traditional approaches
There are two broad approaches to managing uncalled capital.
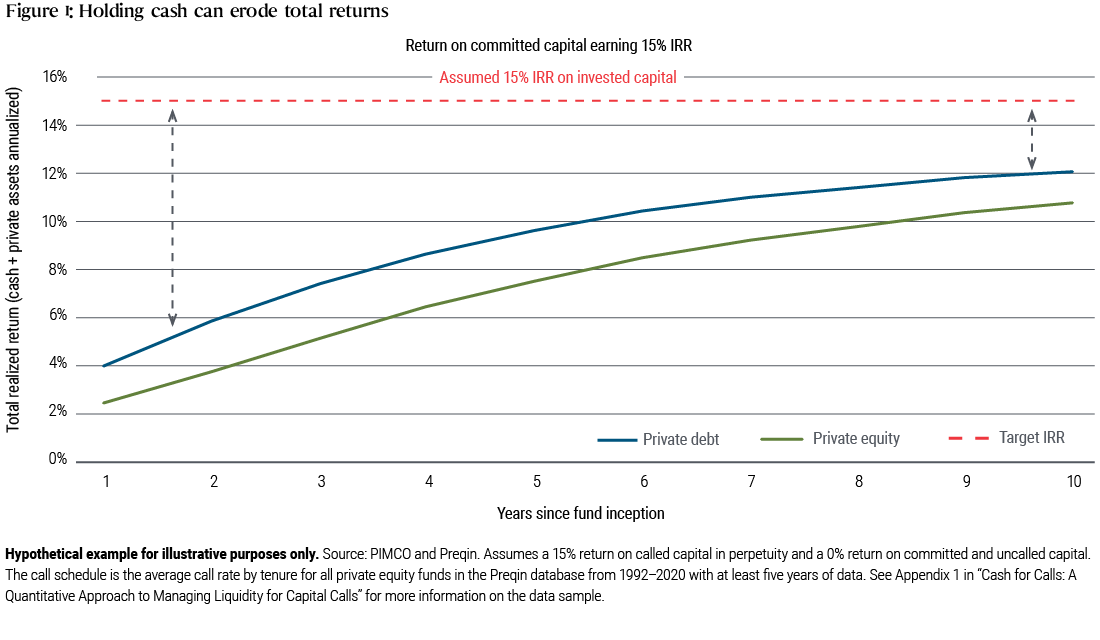
Conservative investors tend to set aside a portion of their commitment in cash or Treasuries. However, this approach may lead to substantial cash drag on the overall expected returns of the illiquid strategy. By some measures, the drag could amount to almost a third of the 15% net internal rate of return (IRR) often targeted by private equity funds (see Figure 1).
More aggressive investors may seek to invest their committed but uncalled capital in liquid funds in an asset class similar to the private market investment – a so-called public market equivalent or PME. These may include public equities for a traditional private equity fund or higher-yielding bonds for private credit.
A major challenge is that capital calls tend to be procyclical. That is, they can occur and even spike at moments of crisis or deep value when public markets, which react in real time, face headwinds (if they are not in utter free-fall). Thus, approaches more aggressive than cash can present additional risk; for example, the decline in value of the liquid PME precisely when capital calls arrive may drive not just paper losses, but the possibility of becoming a forced seller or even outright default by limited partners (LPs).
Applying liquidity tiering for the private market investor
We believe a better approach lies in the middle ground between ultra-conservative cash holdings and the return-seeking PME allocation – for instance, a blend of approaches, with tiered or staggered allocations across ultrashort bonds, short duration fixed income, and public market equivalent assets depending on one’s investment time horizon, liquidity needs, and volatility profile.
How does this work in practice? As detailed in our In Depth piece, one needs to take a comprehensive look at the private market allocation – the timing and size of calls throughout the life of the illiquid fund as well as the need to provide liquidity during the capital call period – and avoid inflicting undue drag on the total investment. By tiering liquidity with a blend of short duration bonds and appropriate lower-risk PMEs, LPs can potentially optimize their alternatives allocation in a way that may help close the gap versus the return potential of a fully invested private market allocation.
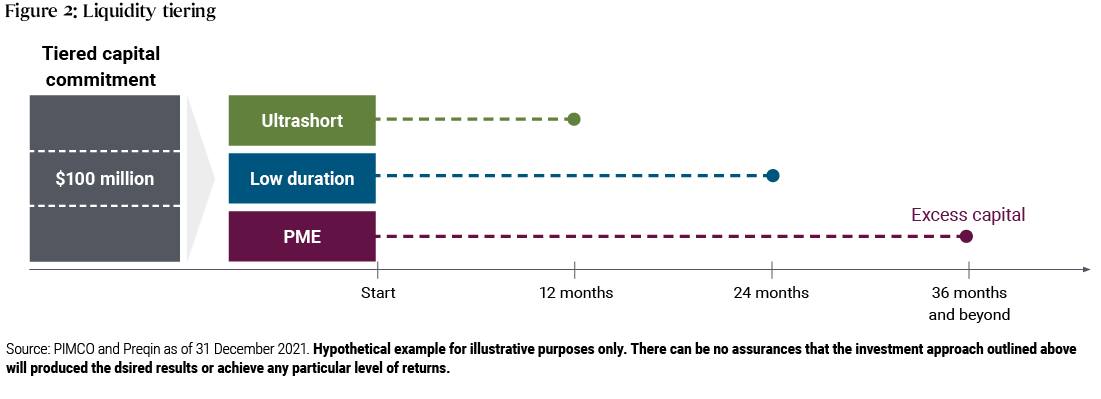
Based on real world call behavior, our research finds that capital for calls anticipated over the next year may be held in active, ultrashort investments with a duration under one year. The next tier consists of capital for calls expected in the second and third years, which may be held in slightly higher-risk (and higher-return-potential) fixed income securities with a matching investment horizon. Finally, remaining capital is held in public market equivalent assets – which for a private debt allocation could be a flexible multi-sector credit strategy or dedicated high yield portfolio (see Figure 2).
This tiering approach provides a customized framework that can be applied to any potential call period. And tiers can be adjusted based on changes to one’s market expectations, either by changing the allocations between tiers, adjusting for a more conservative capital call pacing, or amplifying tier three (PME) exposures via synthetic instruments.
Cash for calls – optimizing a comprehensive private market allocation
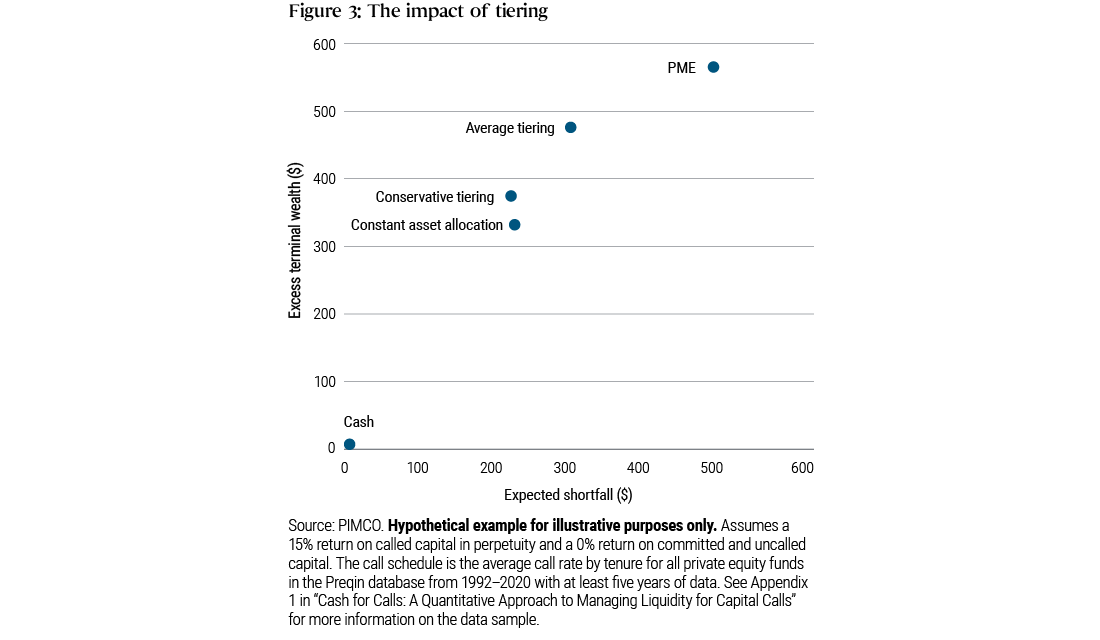
Figure 3 shows the potential benefits of liquidity tiering. It shows two applications, one based on average call rates and another, more conservative, approach that tiers for the highest 10th percentile of call rates each year. The key risk-management concern for uncalled capital is the inability to meet future capital calls. To this end, we consider the expected shortfall – i.e., the average difference between the portfolio’s value and the remaining uncalled capital, whenever the former is less than the latter.
Tiering sacrifices some of the PME’s expected returns, an average of about 20 basis points relative to a full PME approach across simulations (1.98% versus 2.18%). However, the magnitude of shortfalls may be dramatically reduced – on the order of 40% and 55% for average and conservative tiering, respectively.
The dynamics of liquidity tiering can naturally facilitate upside capture and reduce downside risk, and may offer an appealing and flexible way for investors to manage committed yet uncalled capital.


