


After nearly three years of interest rate volatility that tried many investors’ nerves, the outlook for bonds appears the healthiest in years thanks to two key factors: Starting yields are near their highest levels in more than a decade, and markets are on watch for central banks globally to start easing policy after the recent hiking cycle.
Of course, investors are understandably cautious. The historic rate increases in 2022 led to negative returns in most fixed income sectors. In 2023 and 2024, many investors began moving cash off the sidelines as yields reset at healthier levels, only to face renewed volatility.
However, history suggests that today’s starting conditions could add up in bond investors’ favor.
This content is provided for educational purposes only and should not be viewed as investment advice or as an offering of any product or strategy. Consult your financial professional for more information.
A compelling entry point
The compelling nature of today’s fixed income entry point is demonstrated by Figure 1, which outlines potential returns across various fixed income sectors based on current yields and illustrative interest rate movements. This analysis reveals that current starting yields may help anchor return potential for bonds at attractive levels, while also providing a cushion against any further increases in interest rates.
For example, in the multisector bond category, if 2024 follows a similar path as 2023 and rates end where they start, return expectations are a healthy 6%. If rates were to rise, they would need to hit nearly 7% – an increase of over 200 basis points – to turn estimated multisector returns negative, assuming credit spreads remain constant.
Categories with more duration, or interest rate sensitivity, such as core bonds, may also offer a compelling trade-off. Unlike 2022 when starting yields were much lower, returns today are likely to remain positive even with modest further increases in rates. However, if rates fall even 1 percentage point, returns could climb into double digits.
The one category that shouldn’t benefit from falling rates? Cash investments, as a decline in short rates can quickly result in a decline in returns. That’s not to mention the potential opportunity cost missed by not participating in the drop in interest rates and the likely rally one would experience across most fixed income sectors.
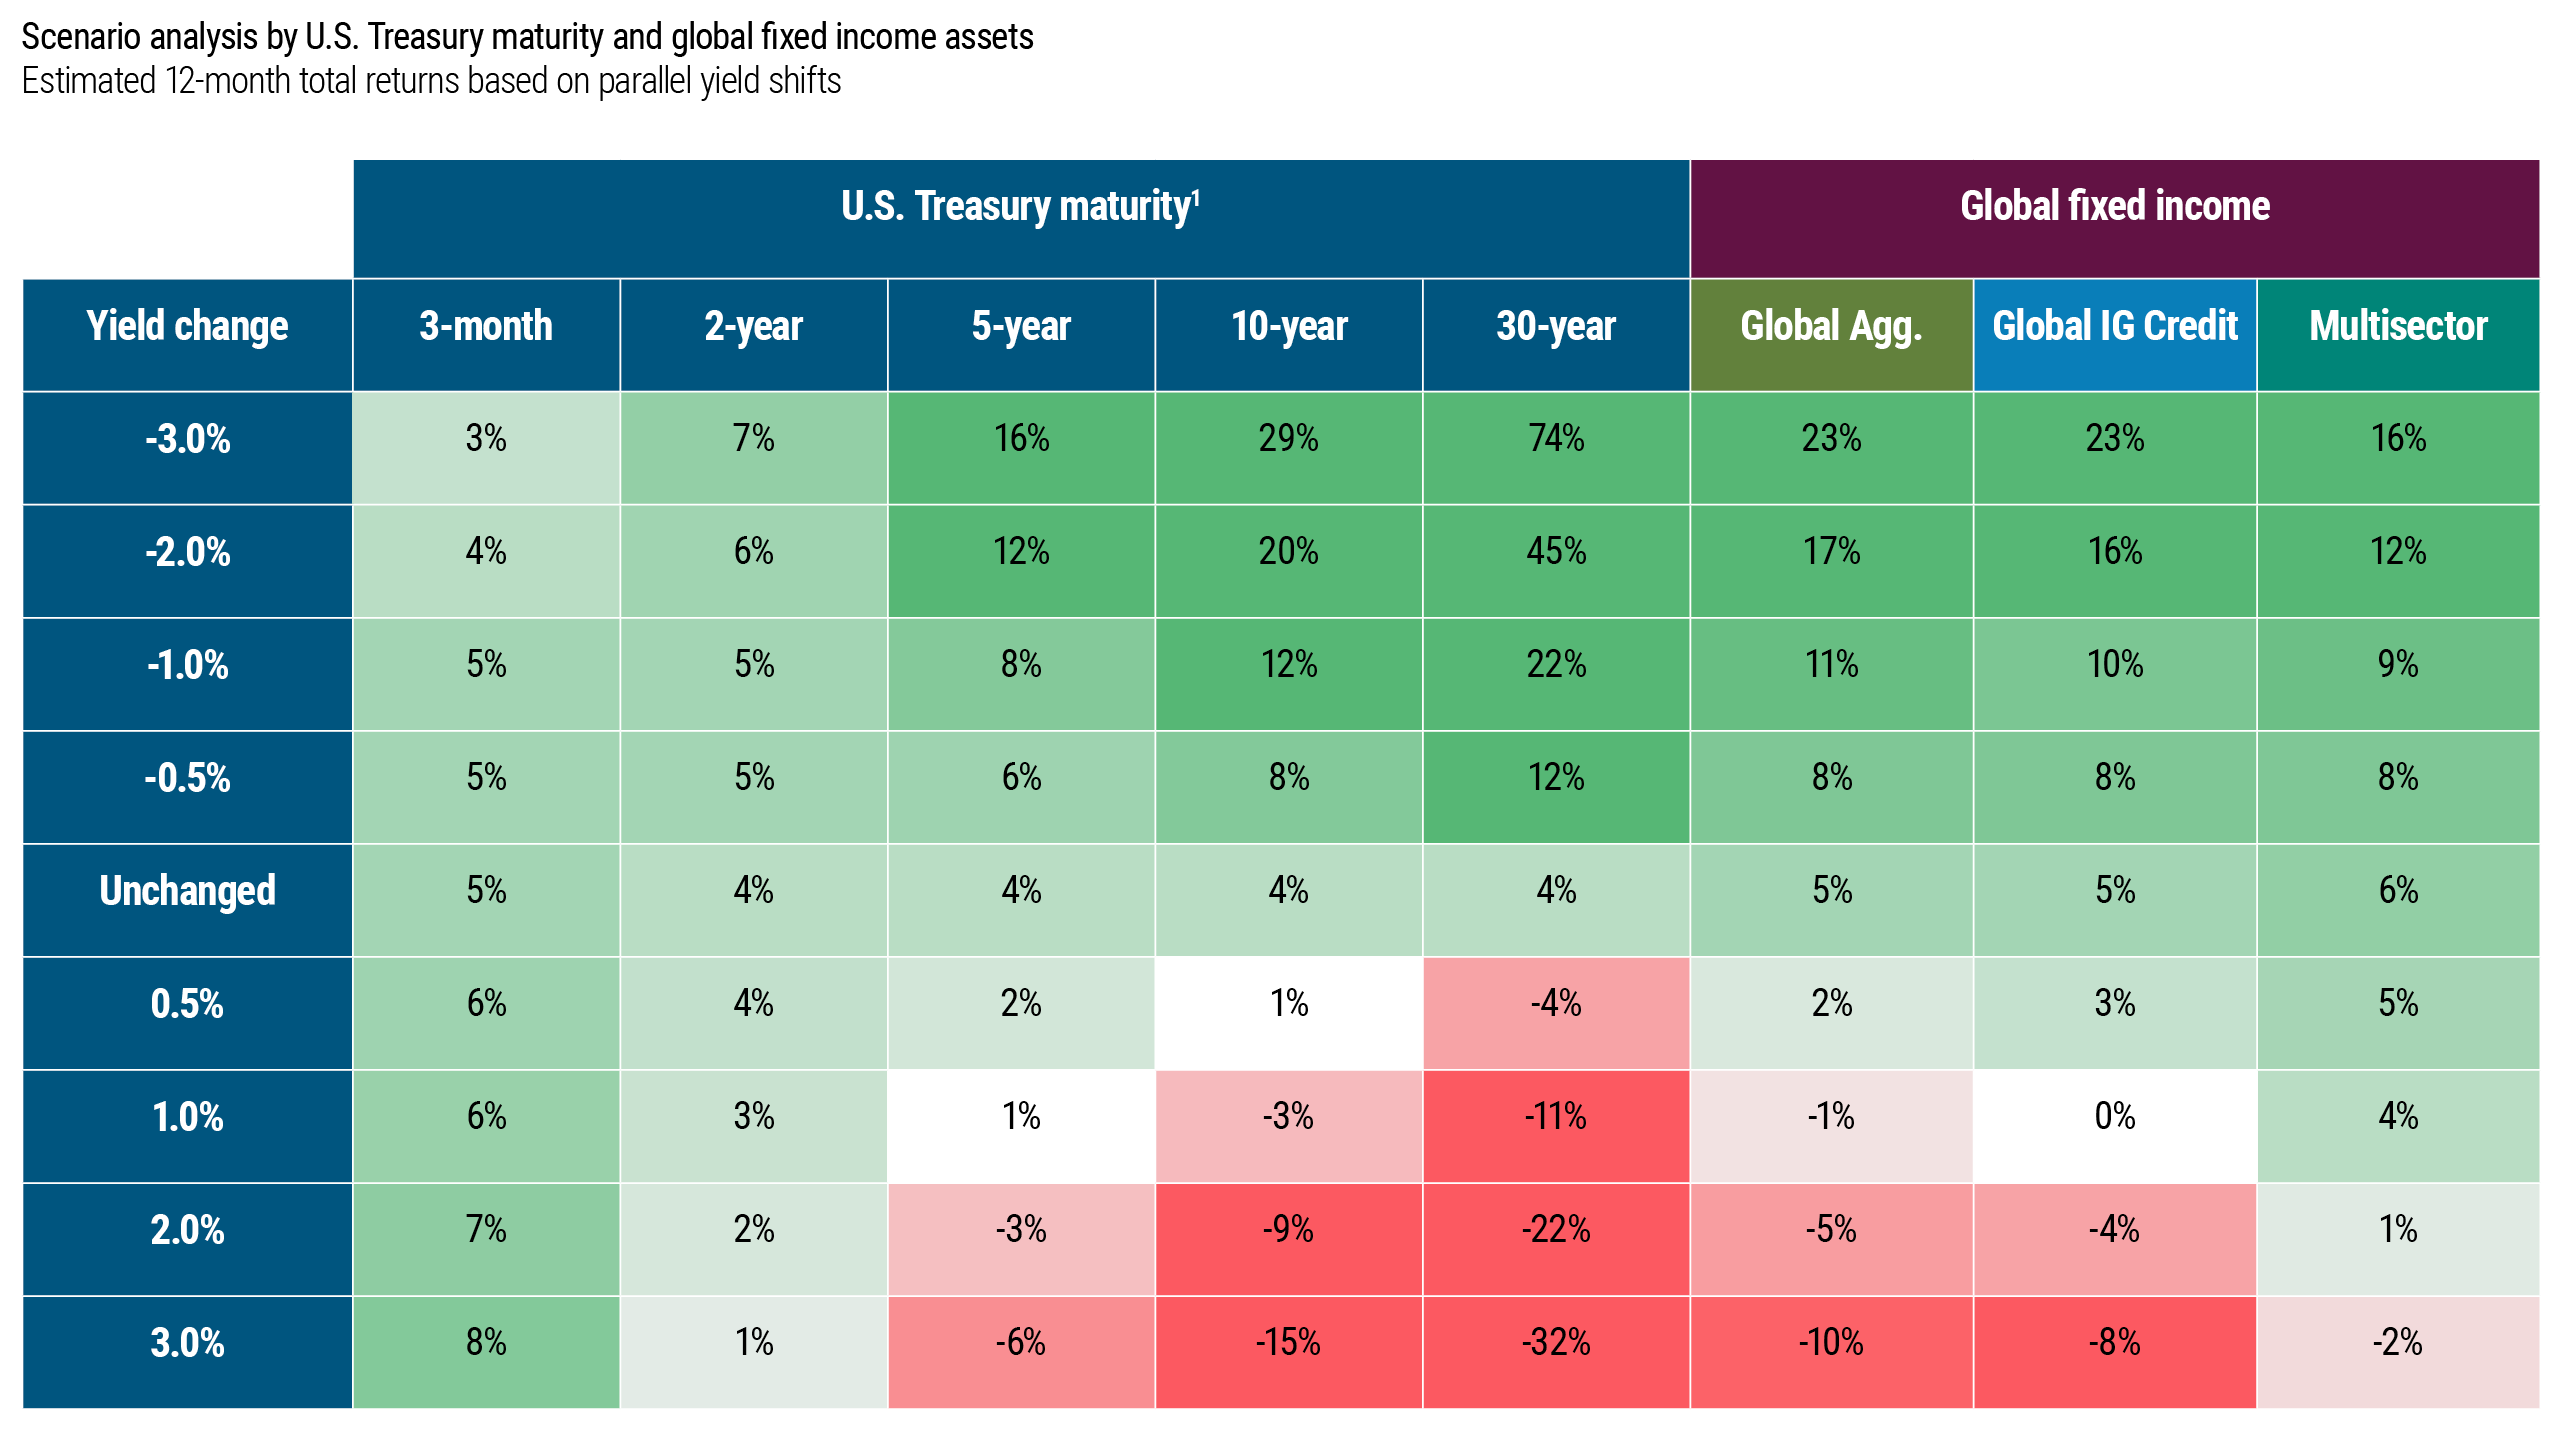
Source: Bloomberg and PIMCO as of 31 March 2024. For illustrative purposes only. Figure is not indicative of the past or future results of any PIMCO product or strategy. There is no assurance that the stated results will be achieved.
Global Agg: Bloomberg Global Aggregate Index (USD-H) , Global IG Credit: Bloomberg Global Aggregate Credit Index (USD-H), Multisector: Morningstar Multisector Bond Category
1 Treasury tenors correspond to a hypothetical treasury bond with the stated maturity which matches the yield on the current treasury curve. In the analysis contained herein, PIMCO has outlined hypothetical event scenarios which, in theory, would impact the yield curves as illustrated in this analysis. No representation is being made that these scenarios are likely to occur or that any portfolio is likely to achieve profits, losses, or results similar to those shown. The scenario does not represent all possible outcomes and the analysis does not take into account all aspects of risk. Total returns are estimated by re-pricing key rate duration replicating portfolios of par-coupon bonds. All scenarios hold OAS constant.
Starting conditions matter
Last year was a clear reminder of the pivotal role that high starting yields play in mitigating downside risks and driving positive returns in fixed income. In the U.S., for example, despite the significant intra-year move in rates, with the 10-year U.S. Treasury yield briefly touching 5% in October, many yields further out the U.S. Treasury curve ended the year roughly where they began. In fact, the 10-year U.S. Treasury yield started and ended 2023 at exactly the same level of 3.88%.
That round trip in yields enabled bonds to end the year on a high note, with returns in the mid to high single digits, as starting yields drove attractive returns. In fact, across most major fixed income sectors, a majority of 2023 returns were driven by yield as opposed to price movements.1 The rally in interest rates in November and December largely reversed price losses from rising rates earlier in the year.
Additionally, though rates rose through October, most fixed income sectors remained positive or only dipped modestly into negative territory as income from higher yields helped offset price losses. That was not the case in 2022, when much lower starting yields and sharper movements in interest rates and spreads drove most fixed income sectors into negative territory. Importantly, looking forward, starting yields in 2024 are much closer to the high levels of 2023 than the lows of 2022. For example, while the yield on the Bloomberg US Aggregate Bond Index stood at 1.70% to start 2022, those levels were 4.65% and 4.52% to start 2023 and 2024, respectively.
Based on history, bonds may still have considerable upside
History suggests we may be in the early days of a bond market rally. As Figure 2 shows, using the U.S. as an example, over the last seven Federal Reserve (the Fed) rate-hiking cycles since 1978, bond market rallies have tended to last more than a year or two after the final hike.
Additionally, as the Fed begins to ease, front-end yields have tended to fall significantly, which hinders cash returns. Meanwhile, even modest declines in interest rates at longer maturities have tended to lead to notable outperformance for fixed income portfolios due to the price appreciation that falling rates provide.
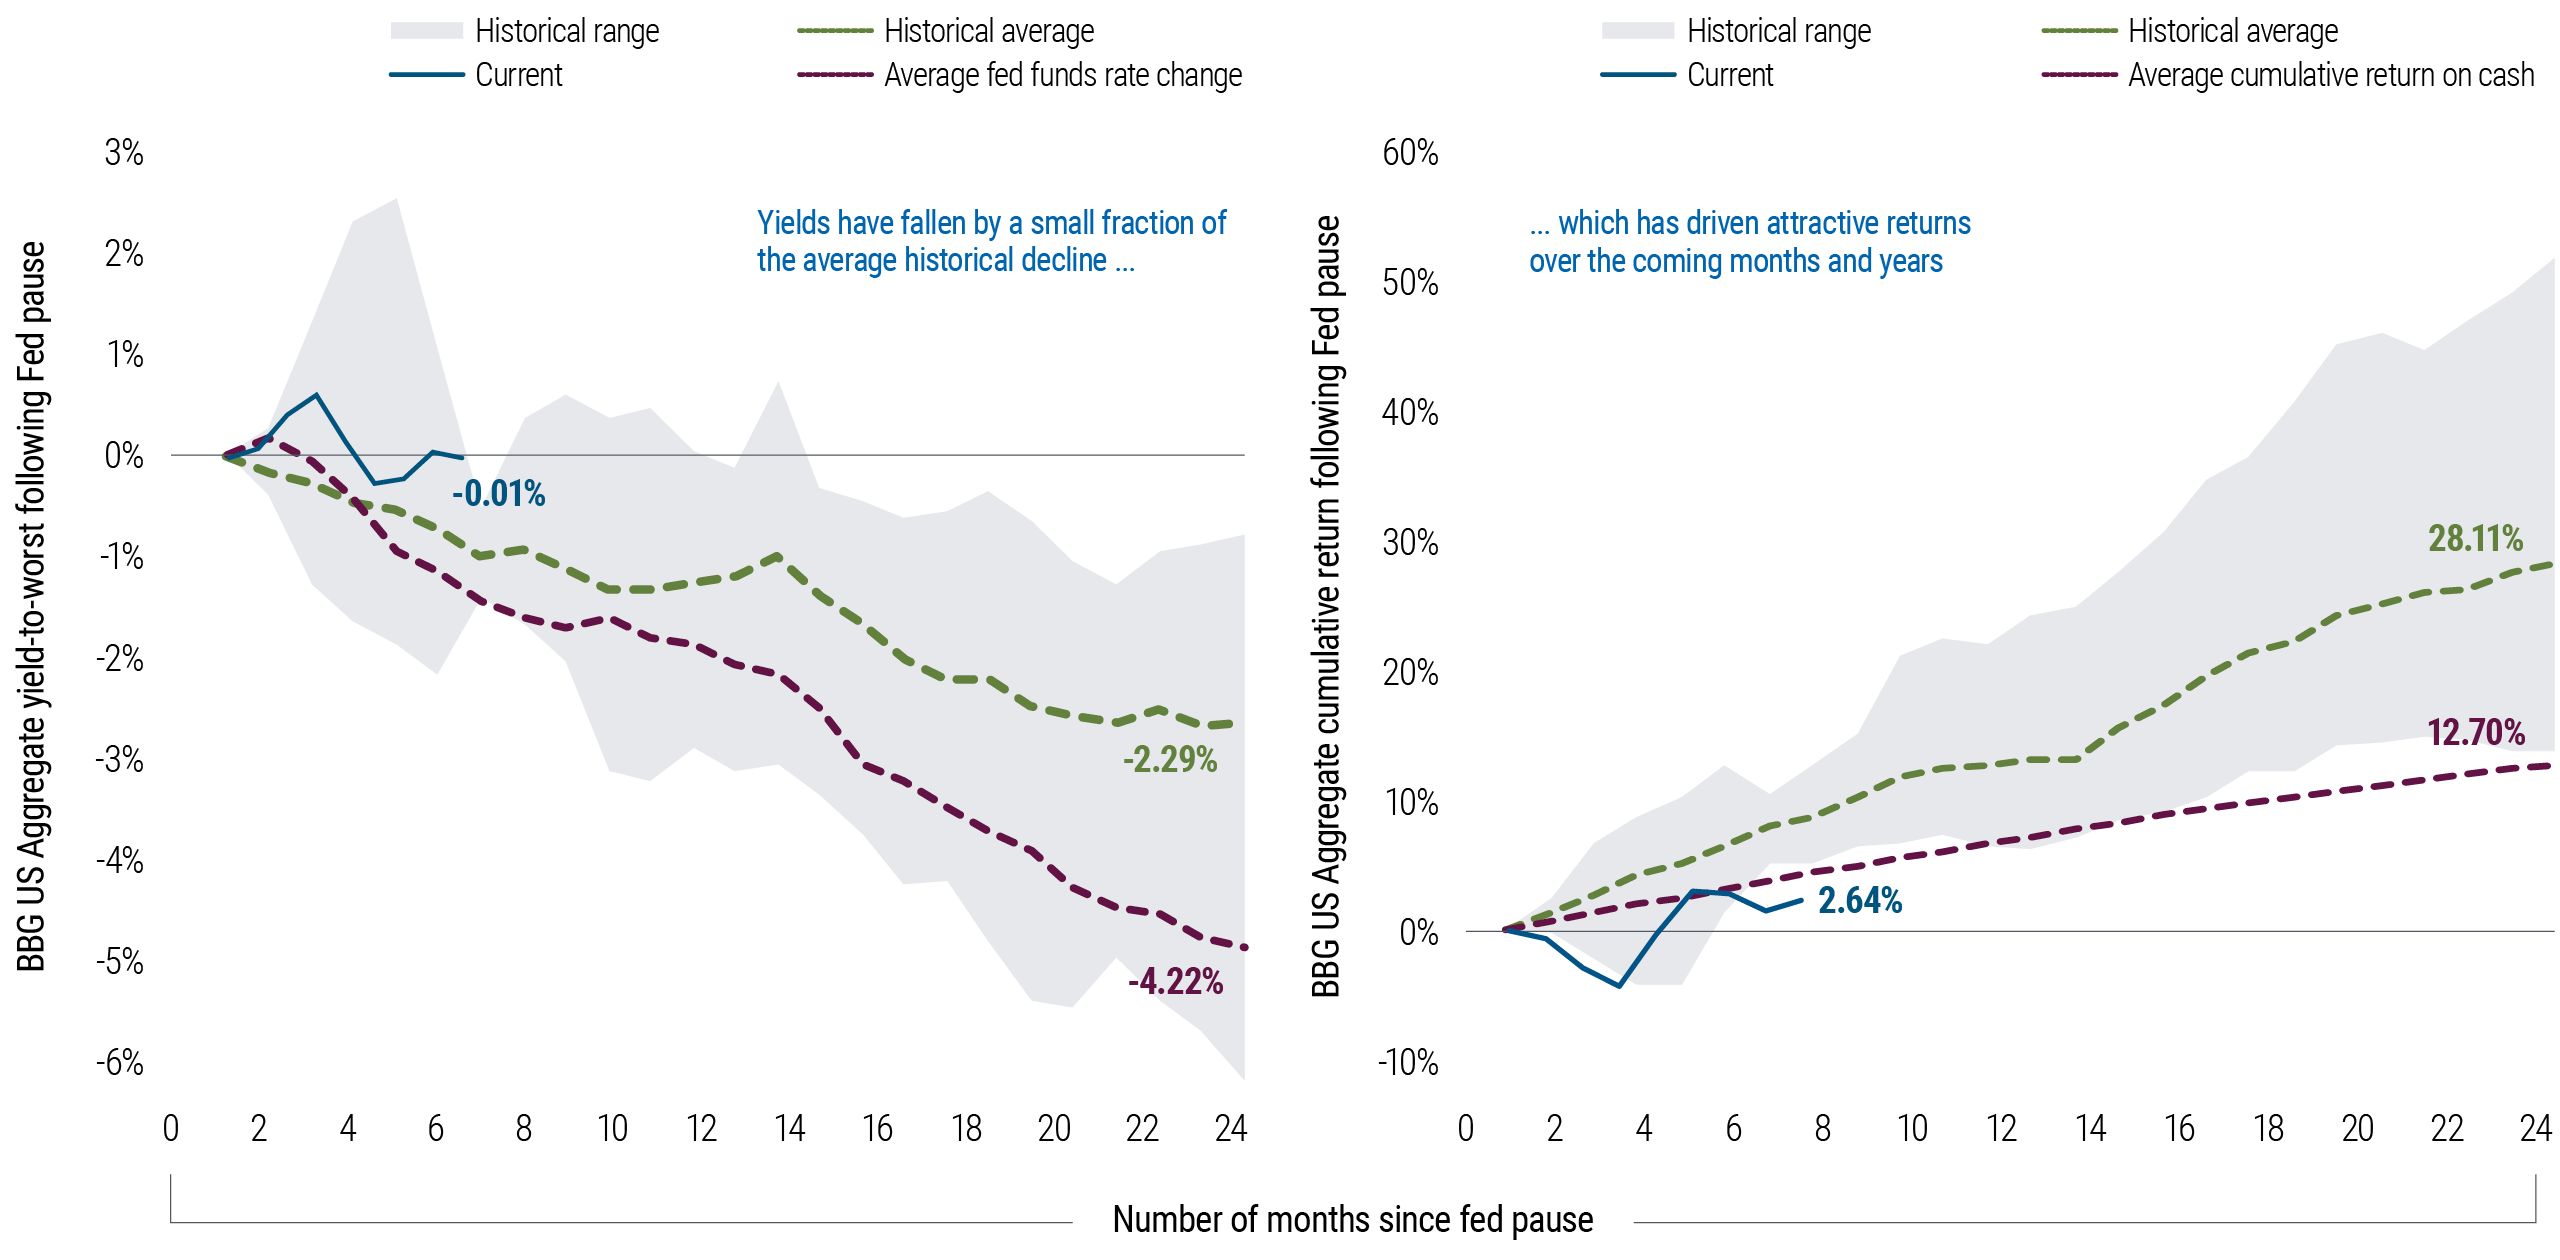
Source: Barclays and PIMCO as of 31 December 2023
Past performance is not a guarantee or a reliable indicator of future results.
Bloomberg (BBG) US Aggregate Index. Yield-to-Worst (YTW) is the estimated lowest potential yield that can be received on a bond without the issuer actually defaulting. Hiking cycles are defined as periods when the Federal Reserve embarks on a sustained path of increasing the target fed funds rate and/or target range. We define the end of a hiking cycle as the month where the Fed reaches its peak policy rate for that cycle (i.e., it either pauses rate hikes or cuts). Hiking cycles include (start to peak). 1980 (Jul '80 to May '81), 1983 (Feb'83 to Aug '84), May 1988 (Feb '88 to Mar '89), 1994 (Jan '94 to Feb '95), 1999 (May '99 to May '00), 2004 (May '04 to Jun '06) and 2015 (Nov '15 to Dec '18).
Looking ahead
While short rates are higher and cash-equivalent investments may remain attractive in the near term, we believe fixed income is the more compelling long-term investment. Yields across most fixed income sectors are at attractive levels rarely seen in the last 20 years. Additionally, compared with last year, the prospect of falling rates could provide an additional tailwind to bond returns.
1 Based on a decomposition of 2023 returns between returns from yields and returns from changes in interest rates or credit spreads for the Bloomberg US Aggregate Index, Bloomberg US Credit Index, Bloomberg MBS Fixed Rate Index, Bloomberg US Corporate High Yield Index, JPM EMBI Global Index, Bloomberg Municipal Bond Index, and Bloomberg High Yield Muni Bond Index. ↩