Me and Morgan le Fay
As is a dad’s prerogative, I think my one and only Jonathan, 10-years old, is the greatest kid in the world. He is into magic, which is not all that unusual, but such is his passion for illusions by sleight of hand that he has been an active member of the Young Magicians of America since he was eight. And so it was that while I was in the Middle East in December 1998, Jon convinced his mom, my lovely wife Karen, that he should accept a fellow magician’s offer of a beautiful Netherlands dwarf rabbit — who had grown too big for pulling out of hats!
Learning of this new addition to our family from a pay phone at Heathrow, I arrived home with trepidation to meet “him,” who Jon had naturally named Merlin. Casting aside my concerns about just who would be the ultimate caregiver, I took this beautiful bunny into my arms and quickly discovered that “he” was actually a “she.” Without missing a beat, Jon quickly renamed her Morgan le Fay.
Karen and I did not have the heart to explain to Jon that history is unclear on whether Morgan le Fay was a force for evil or good, so she became Ms. Morgan le Fay McCulley. And notwithstanding confirmation of my suspicions about the caregiving, I developed quite a fondness for the furry little creature. So, when I moved to Newport Beach last year ahead of Karen and Jon, waiting for the school year to run its course, Jon declared that Morgan should come live with me, to keep me from “getting lonely.” Told you he was the world’s greatest kid!
As colleagues near me on PIMCO’s trading desk will testify, I spoil Morgan shamelessly, spending $10 a throw on her favorite greens – especially dandelions! — at Newport Beach’s hoity-toity Gelson’s market. But it’s money well spent because, when properly bribed, Morgan is a playful companion for hours while I read and work at home – a force of good.
She displays the dark side of her magical legacy only when it comes time for her to give up free reign of the apartment and move to her hutch on the patio: She insists on playing hide and seek for at least 30 minutes before she will “let” me catch her. I swear after each episode that the apartment is going to become off limits to the lady. But after a day or two, I can’t resist the joy of watching her hop about, and we go through the routine yet again!
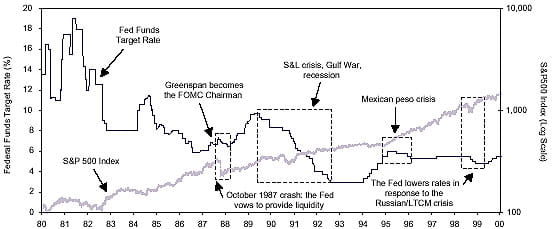
Stocks' Mantra: When Stuff Happens, The Fed Eases
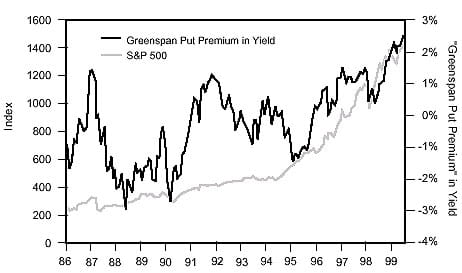
Figure 1
Source: Merrill Lynch
Alan's Morgan le Fay
I don’t know if Alan Greenspan has a furry little pet like Morgan at home, but it is unambiguously clear that he has one at the office: the U.S. stock market! She is essentially a good girl, both reflecting the wonder of the U.S. economy and fueling it with the self-fulfilling procreative powers of “creative destruction.” This is nowhere more clear than in the “bi-furcated” character of the U.S. stock market, with growth stocks flying and cyclical stocks languishing.
Soaring P/E multiples for technology enterprises cut the cost of equity capital to effectively nothing for the New Economy, channeling funds for capital investment away from the Old Economy, where stagnant P/E multiples are supported by share buybacks funded through increased leverage. In the long run, this is as it should be: The frontier of growth is funded, while the pillars of yesterday are essentially liquidated.
But like Jonnie’s bunny, the Morgan le Fay stock market does not know when to stop. Most high-tech companies riding on “free” equity will go broke. Only a few will eventually generate robust cash flow, thereby justifying current valuations. The problem, for both investors and policymakers, is that since no one knows who the winners will be, it is rational from a bottom-up perspective for investors to own a basket of the things, at irrationally high P/Es. But from a top-down perspective, the aggregate valuation of the sector makes no sense. It is a “rational, irrational bubble!”
In January 1999, Mr. Greenspan quite cleverly compared this aggregate “excess” valuation to a “lottery” premium: Bottom-up, gamblers (investors) are willing to pay more than the Net Expected Value of an individual lottery ticket (dot.com stock!), because the pay-off of the “game” is both real, and huge. Indeed, as Greenspan sagely noted, this is the essence of the huge profits from lotteries from time immemorial.
The macroeconomic problem with all of this, of course, is that the bidding up of the lottery tickets before the winners are announced generates (1) a wealth effect that excessively stimulates aggregate demand (relative to the Fed’s desire); and (2) implies a great deal of excess capital investment along the way. In the short run, this dynamic implies a “need” for deflationary monetary policy for the Old Economy. And in the long run, this dynamic implies excess capacity in the New Economy, which will render the entire economy less elastic to reflationary monetary policy. In a nutshell, this dynamic implies a boom-bust scenario.
Alan's Excalibur
This is particularly the case if equity investors believe that King Alan will protect them with the Excalibur of liquidity creation whenever something threatens to go wrong. And indeed, the record of the Greenspan era strongly supports the proposition that Mr. Greenspan has written equity investors a re-liquefaction “put” option struck below the market, as vividly displayed in Figure 1.
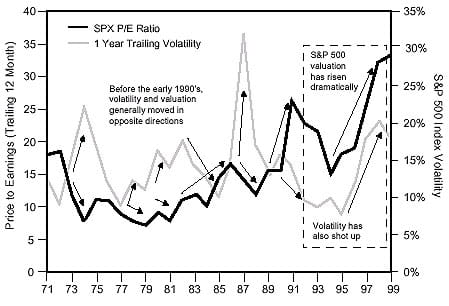
The Morgan le Fay stock market, like Jonnie’s bunny, need not be concerned about enduring discipline for excessive frivolity. As further “proof” of the Greenspan Put, P/E multiplies have risen as the market as become more volatile, as displayed in Figure 2. This is the opposite of what finance theory rationally postulates, and can be rationally “explained” only by the existence of an ever-rising trailing “put” that the Fed is giving to equity investors.
P/E's Rise Despite Rising Volatility:
The Greenspan Put in Action
Figure 2
Data Source: Merrill Lynch
Greenspan would disagree, of course, and argue that rising P/E multiples in the face of rising equity market volatility can be “explained” by accelerating productivity growth and, thus, an accelerating return on capital investment. To my mind, however, this can only be part of the explanation, because the return to capital investment is no longer accelerating, as displayed in Figure 3.
Thus, rising P/Es, in the context of both rising market volatility and rising real risk-free interest rates can only be “explained” by a falling equity risk premium, which is “logical” only if the Fed has written a “put” to equity investors. To get a handle on this, let’s consider again the equity valuation metric discussed last month:
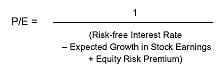
Let’s now add the Greenspan Put such that:
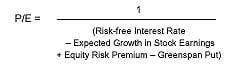
Now, let’s put some numbers on the table: (1) A 4% real long-term interest rate, which is today’s long-term TIPS yield; (2) a 4% real earnings growth assumption, which is consistent with a generous 4% real GDP growth assumption trajectory; and (3) a 5.5% equity risk premium assumption, which is the historical outcome. Given those assumptions, what valuation “falls out” for the Greenspan Put? The answer is 2.5%, which is an all-time high, as displayed in Figure 4 1 . To wit, the equity market has become a bubble, inflated with “too big to fail” Fed ether. Without the Greenspan Put, the P/E for the S&P 500, assuming the historical 5.5% equity risk premium, “should” be 18, not 32!
PIMCO's View
Here at PIMCO, there is widespread support for this line of reasoning as to the existence of an equity bubble. Almost to a person, we believe that Mr. Greenspan should quit giving away puts on the equity market. No surprise, you say, because you’re bond managers! It is no doubt true that we resent the fact that asset allocators find the Morgan Le Fay equity market to be more appealing than our pedestrian fixed income offerings. After all, bond managers are born with an inferiority complex!
Returns On Capital Investments Are High,
But No Longer Accelerating
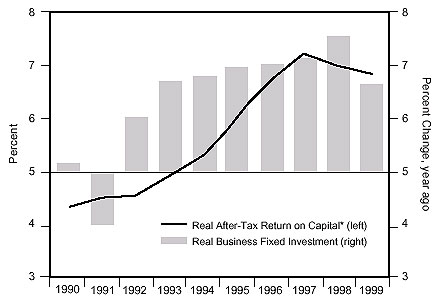
Figure 3
Data Source: Goldman Sachs
Putting A Value On The Greenspan Put
Figure 4
Data Source: Merrill Lynch
At the same time, we also recognize that we must configure your portfolios not for a world that we think should exist, but for the one that does exists. For example, while I may think the case for a Fed hike in margin requirements on stocks is compellingly clear, it is also clear, as Bill Gross tells me in no uncertain terms, it simply isn’t going to happen. And he’s right!
No, the baseline scenario is that the Morgan le Fay equity market is going to continue to fuel robust growth, and that the Fed is going to continue hiking short-term interest rates in response. Until something “breaks.” A corollary of this baseline scenario is that the U.S. budget surplus is going to continue growing, on the back of both robust growth and tax receipts from Ms. le Fay’s capital gains. Until something “breaks.”
These realities, as opposed to my normative hopes, carry three simple fixed income implications:
- Real short-term interest rates will continue to rise, on the back of further Fed tightening;
- The inverted intermediate-to-long Treasury curve will stay inverted, and possibly invert even more, on the “technical” back of surplus-driven pay downs and buybacks, and expectations of the “eventual” bust down the road; and
- Spreads-to-Treasuries for both mortgages and corporates are far more likely to widen than tighten, on the back of increased volatility and, again, expectations of the “eventual” bust down the road.
Simply put, if the Fed is going to shamelessly spoil stocks like I spoil Jonnie’s bunny, then the effects of Fed tightening discipline are going to be manifest in other asset classes. We might not like it, but that’s just the way it is. Our business, and your portfolios are the “targets!”
Since you pay us to outperform fixed income benchmarks, regardless of how wretched the absolute return of those benchmarks may be, our real-time job is to minimize the effect of the Fed’s discipline on your portfolios, while being strategically prepared for the day when something “breaks.”
We are armed and ready with increased allocations to Treasury long bonds.
Paul McCulley
Executive Vice President
February 8, 2000
mcculley@pimco.com
1 Special thanks to Merrill Lynch’s Steve Kim for his collaboration with me on this analysis.
Disclosures
No part of this publication may be reproduced in any form, or referred to in any other publication, without express written permission.
This article contains the current opinions of the author but not necessarily Pacific Investment Management Company, and does not represent a recommendation of any particular security, strategy or investment product.
The author's opinions are subject to change without notice. Information contained herein has been obtained from sources believed to be reliable, but is not guaranteed.
This article is distributed for educational purposes and should not be considered as investment advice or an offer of any security for sale. Past performance is not indicative of future results and no representation is made that the stated results will be replicated. Copyright ©1999-2003 Pacific Investment Management Company LLC. All rights reserved.