Monthly Municipal Market Update, January 2023
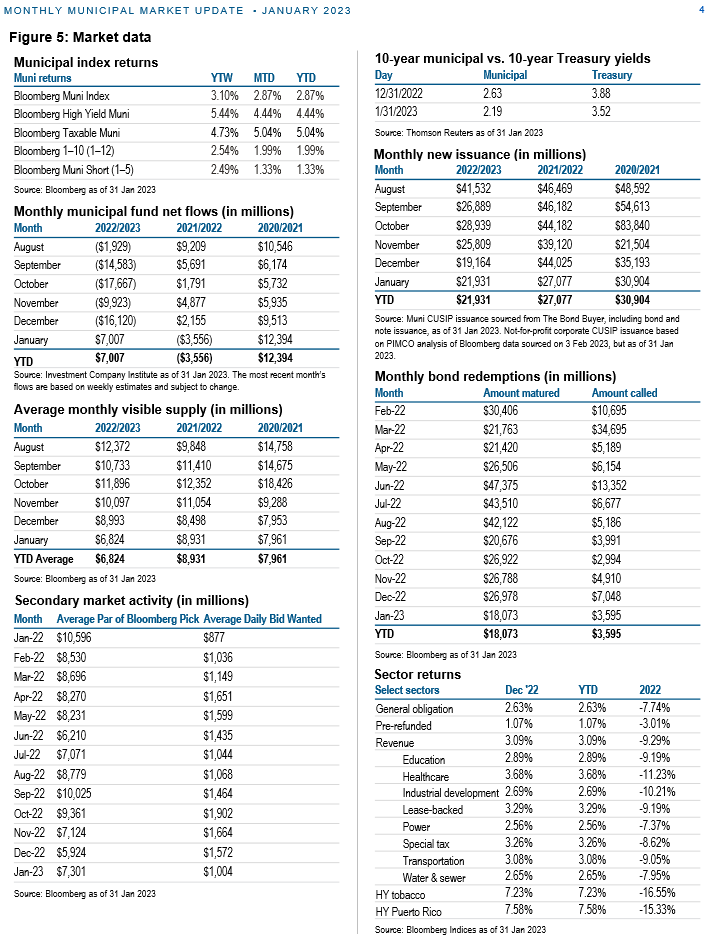
- The Bloomberg Municipal Bond Index returned 2.87% in January, its strongest start to the year in over a decade.
- The Federal Reserve raised rates by a quarter percentage point at its latest meeting, and implied another 25 basis point hike is likely at its next meeting.
- We focus on the “January effect,” a unique phenomenon in the municipal market where favorable market technicals often lead to strong returns.
January month in review
U.S. equities and fixed income each notched solid gains to close out the first month of 2023, fueled by investor optimism that the Federal Reserve (Fed) is nearing the end of its rate-hike cycle.Footnote1
This optimism was ultimately supported by the Fed’s decision on 1 February to raise rates by just a quarter percentage point, slowing the pace of its hikes for the second consecutive time. The benchmark lending rate now sits at 4.50%-4.75%, a level not reached since 2007. In a statement released following the meeting, Fed officials acknowledged that despite recent improvement in inflation printings, “The committee anticipates that ongoing [rate] increases . . . will be appropriate in order to attain a stance of monetary policy that is sufficiently restrictive.” Many interpret this statement to imply the Fed is likely to raise rates by another 25 basis points (bps) at both its March and May meetings; this would align with the majority of Fed officials’ latest expectations (as of December) for rates to ultimately peak in the 5.00%-5.25% range.Footnote2
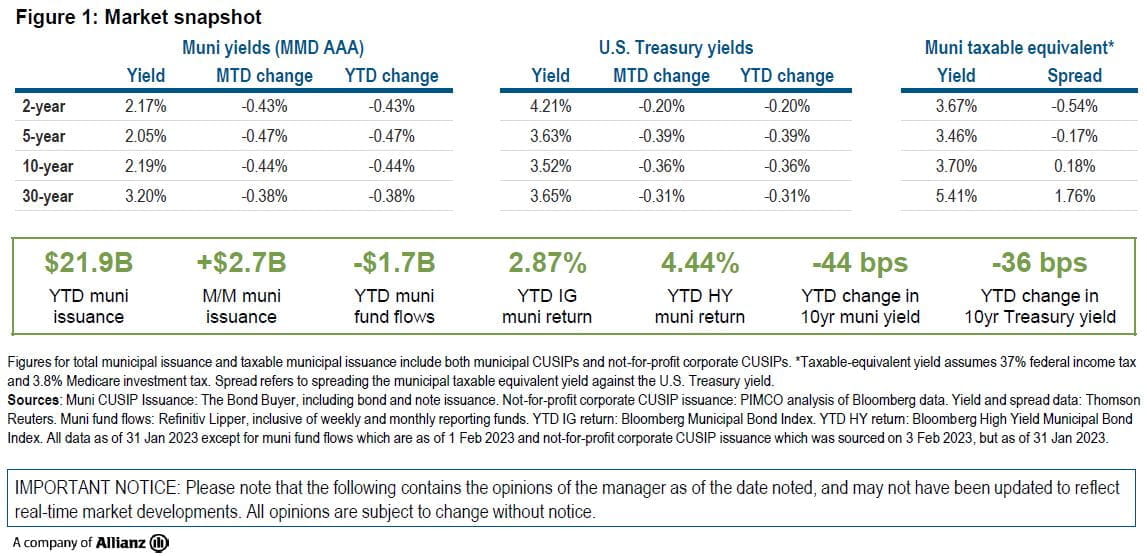
The Bloomberg U.S. Treasury Index returned 2.51% in January, its strongest monthly gain since January 2020.Footnote3 The 1-, 5-, 10- and 30-year tenors of the U.S. Treasury yield curve closed the month at 4.69% (-4 bps), 3.63% (-39 bps), 3.52% (-36 bps), and 3.65% (-31 bps), respectively.Footnote4
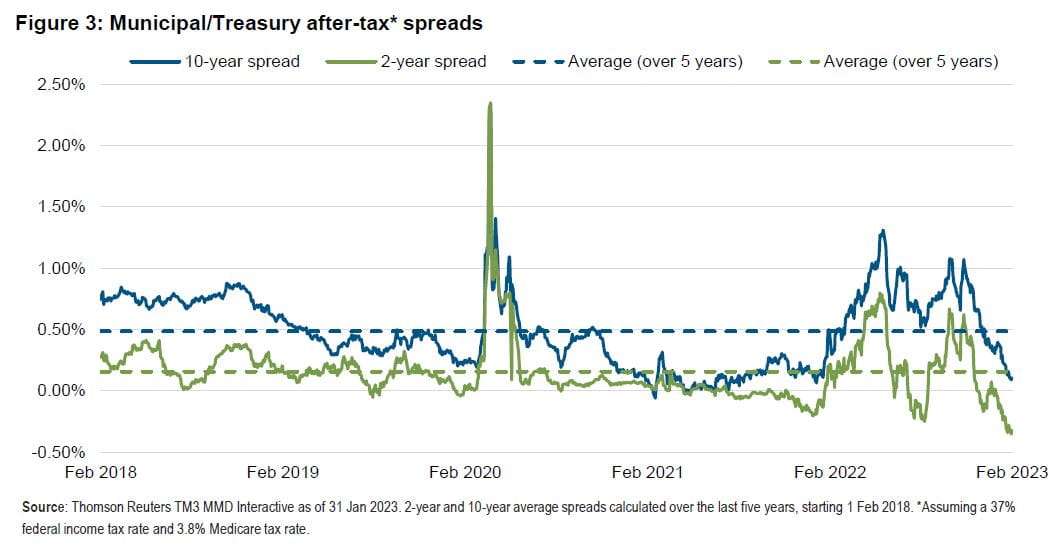
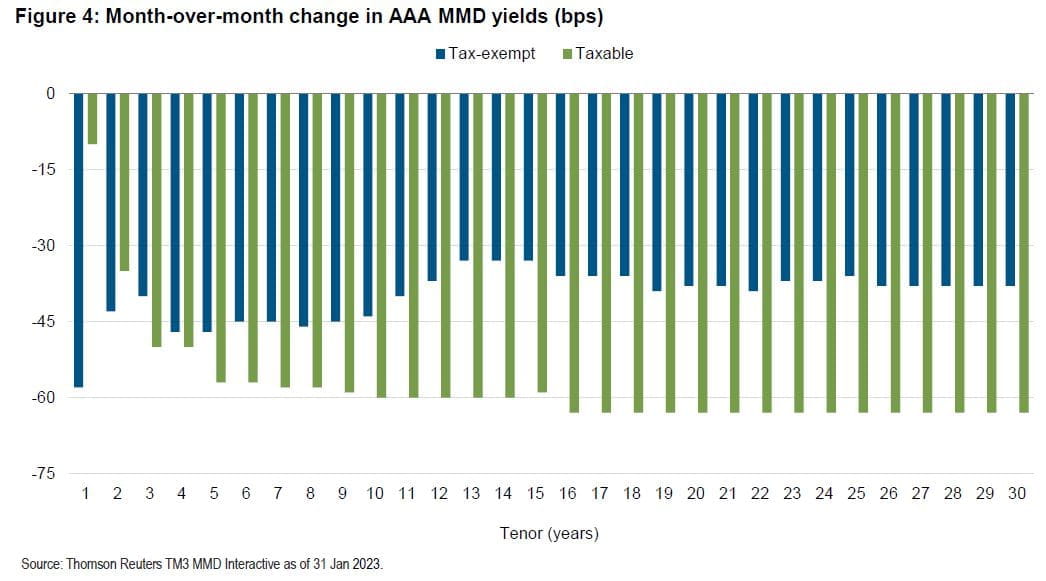
A broad fixed income rally and favorable municipal market technicals – specifically the “January effect,” which we explore in this month’s “In Focus” section – resulted in a strong month of performance for the asset class. The Bloomberg Municipal Bond Index gained 2.87% in January, outperforming the Treasury index by 36 bps over the month. The lower-quality and taxable sectors of the muni market fared even better: Bloomberg’s High Yield Municipal Bond and Taxable Municipal Bond indices returned 4.44% and 5.04% in January, respectively.Footnote5 AAA Municipal Market Data (MMD) yields declined dramatically across the curve over the month, with the 1-, 5-, 10- and 30-year tenors closing at 2.28% (-58 bps), 2.05% (-47 bps), 2.19% (-44 bps), and 3.20% (-38 bps), respectively.Footnote6 Municipal-to-Treasury ratios currently sit at 12-month lows, while tax-equivalent spreads from AAA munis to Treasuries are negative out to five years.Footnote7*
January’s municipal market issuance of $21.9 billion represented a relatively dramatic year-over-year decline (down 19% relative to January 2022).Footnote8 A good portion of this can be attributed to uncertainty surrounding the path of future Fed rate decisions, the possibility of recession on the horizon, and still-elevated inflation.
Following two weeks of outflows from muni funds to kick off the year, flows for the asset class reversed course: Weekly and monthly reporting funds posted three consecutive weeks of inflows to close the month. Even with the surge of funds into the asset class, however, year-to-date flows were still negative for the period ending 1 February, totaling $1.7 billion. It appears likely that the longest outflow cycle on record, totaling $127.4 billion over 53 weeks, is now in the rearview mirror.Footnote9
January effect in focus: Muni market begins year with strong returns
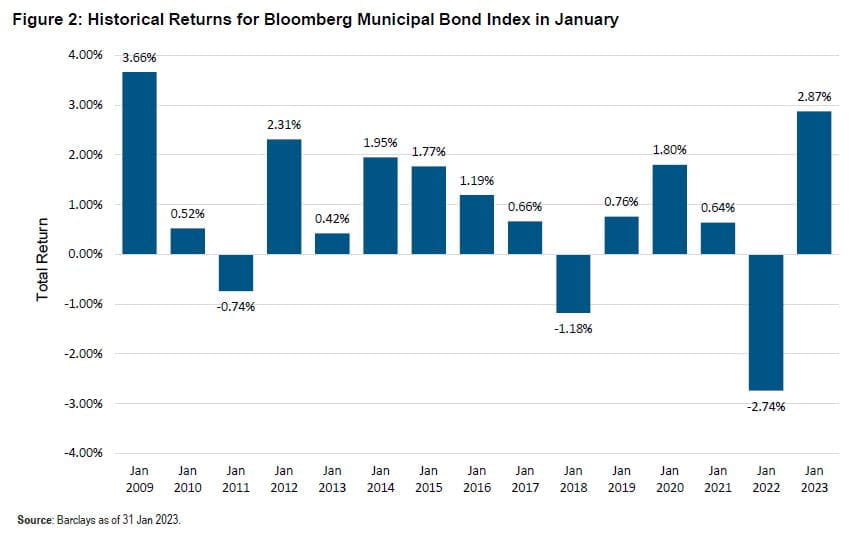
Key municipal market indices – the Bloomberg Municipal Bond Index and Bloomberg High Yield Municipal Bond Index – posted respective returns of 2.87% and 4.44% in January.Footnote10 These relatively robust returns were largely driven by a municipal market phenomenon known as the January effect. Essentially, municipal asset prices tend to appreciate in January as seasonal factors bring elevated demand coupled with limited supply.
Although the effects of this phenomenon are not guaranteed every year, the necessary conditions presented themselves this year, and ultimately resulted in the strongest January performance for munis since 2009 (see Figure 2). Given 2022’s market downturn, investors engaged in a flurry of tax-loss harvesting activity before the year ended. This, coupled with about $27 billion of December 2022 maturities, roughly $5.2 billion in called bonds, and approximately $11.1 billion in tax-exempt coupon payments gave investors a plethora of reinvestment capital.Footnote11,12 These tailwinds, in addition to attractive yields, constructive credit fundamentals, and a relatively low monthly supply of just $21.9 billion, contributed to the municipal market’s strong performance.Footnote13
To learn more about investing in municipals at PIMCO, please visit pimco.com/munis.
1 Caitlin Ostroff and Eric Wallerstein, “Stocks Cap Strong January With Gains as Investors Look to Fed Meeting,” Wall Street Journal, 31 Jan 2023 Return to content
2 "Nick Timiraos, “Fed Approves Quarter-Point Rate Hike, Signals More Increases Likely,” Wall Street Journal, 1 Feb 2023 Return to content
3 Bloomberg, 31 Jan 2023Return to content
4 Thomson Reuters TM3 MMD Interactive Data, 31 Jan 2023Return to content
5 Bloomberg, 31 Jan 2023 Return to content
6 Thomson Reuters TM3 MMD Interactive Data, 31 Jan 2023Return to content
7 Jessica Lerner and Christine Albano, “Munis close out January relatively steady,” The Bond Buyer, 31 Jan 2023Return to content
8 The Bond Buyer: Primary Market Statistics – A Decade of Bond Finance, 31 Jan 2023; Bloomberg Corporate Issued Municipals Data, 3 Feb 2023Return to content
9 Refinitiv Lipper US Flow, J.P. Morgan, 2 Feb 2023. Note: combined weekly and monthly flowsReturn to content
10 Bloomberg, 31 Jan 2023Return to content
11 Ibid Return to content
12 Siebert’s New Improved Municipal Cash Flow 2023 Report, 31 Dec 2022 Return to content
13 The Bond Buyer: Primary Market Statistics – A Decade of Bond Finance, 31 Jan 2023; Bloomberg Corporate Issued Municipals Data, 3 Feb 2023Return to content
Disclosures
Past performance is not a guarantee or a reliable indicator of future results.
Investing in municipal bonds involves the risks of investing in debt securities generally and certain other risks. Investors will, at times, incur a tax liability. Income from municipal bonds is exempt from federal income tax and may be subject to state and local taxes and at times the alternative minimum tax. Investing in the bond market is subject to risks, including market, interest rate, issuer, credit, inflation risk, and liquidity risk. The value of most bonds and bond strategies are impacted by changes in interest rates. Bonds and bond strategies with longer durations tend to be more sensitive and volatile than those with shorter durations; bond prices generally fall as interest rates rise, and low interest rate environments increases this risk. Reductions in bond counterparty capacity may contribute to decreased market liquidity and increased price volatility. Bond investments may be worth more or less than the original cost when redeemed.
The credit quality of a particular security or group of securities does not ensure the stability or safety of an overall portfolio. The quality ratings of individual issues/issuers are provided to indicate the credit-worthiness of such issues/issuer and generally range from AAA, Aaa, or AAA (highest) to D, C, or D (lowest) for S&P, Moody’s, and Fitch respectively.
Statements concerning financial market trends or portfolio strategies are based on current market conditions, which will fluctuate. There is no guarantee that these investment strategies will work under all market conditions or are appropriate for all investors and each investor should evaluate their ability to invest for the long term, especially during periods of downturn in the market. Outlook and strategies are subject to change without notice.
PIMCO does not provide legal or tax advice. Please consult your tax and/or legal counsel for specific tax or legal questions and concerns.
Bloomberg Municipal Bond Index consists of a broad selection of investment-grade general obligation and revenue bonds of maturities ranging from one year to 30 years. It is an unmanaged index representative of the tax-exempt bond market. The index is made up of all investment grade municipal bonds issued after 12/31/90 having a remaining maturity of at least one year. The Bloomberg High Yield Municipal Bond Index measures the non-investment grade and non-rated U.S. tax-exempt bond market. It is an unmanaged index made up of dollar-denominated, fixed-rate municipal securities that are rated Ba1/BB+/BB+ or below or non-rated and that meet specified maturity, liquidity, and quality requirements. The Bloomberg Taxable Municipal Index represents a rules-based, market-value weighted index engineered for the long-term taxable bond market. For inclusion in the Index, bonds must be rated investment grade quality or better, have at least one year to maturity, have a coupon that is fixed rate, have an outstanding par value of at least $7 million, and be issued as part of a transaction of at least $75 million. The Intermediate Municipal subsector groups together securities with an average maturity between one to 10 years. The Bloomberg 1-10 Year Municipal Bond Index is an unmanaged index considered to be generally representative of investment-grade municipal issues having remaining maturities from 1-10 years and a national scope. The Bloomberg Muni Short (1-5) Index is the Muni Short (1-5) component of the Bloomberg Municipal Bond Index. It is not possible to invest directly in an unmanaged index.
PIMCO as a general matter provides services to qualified institutions, financial intermediaries and institutional investors. Individual investors should contact their own financial professional to determine the most appropriate investment options for their financial situation. This material contains the current opinions of the manager and such opinions are subject to change without notice. This material has been distributed for information purposes only and should not be considered as investment advice or a recommendation of any particular security, strategy, or investment product. Information contained herein has been obtained from sources believed to be reliable, but not guaranteed. No part of this material may be reproduced in any form, or referred to in any other publication, without express written permission. PIMCO is a trademark of Allianz Asset Management of America LLC in the United States and throughout the world. ©2023, PIMCO.
CMR2023-0209-2731618
